| FISH Analysis |
| |
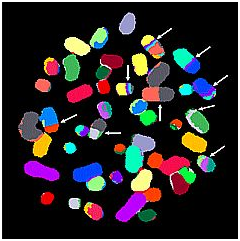
| Analysis Examples of M-FISH |
| G-band Karyotype Image |
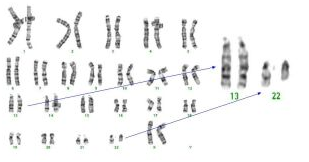 |
| t(13;22) (q12;q11.2) |
| |
| M-FISH Metaphase Image |
 |  |
| |
| M-FISH of Human Leukemia-originated Cell Line |
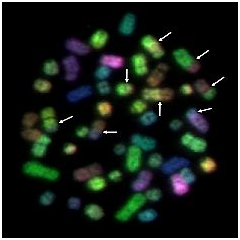 |  |
| True Color | Code Color |
| |
| Human iPS Cells FISH | |
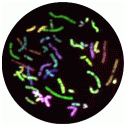
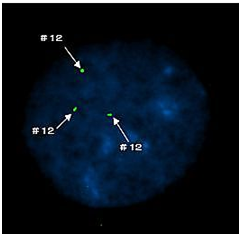 | Interphase Image of Human iPS Cells
Use D12Z1 probe
Detected 3 signals.
One excess of Chromosome 12
|
|
| |
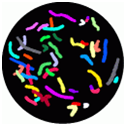
| Metaphase Image of Mouse iPS Cells | |
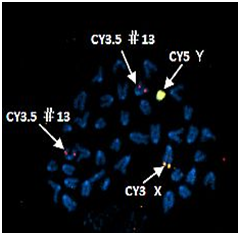 | 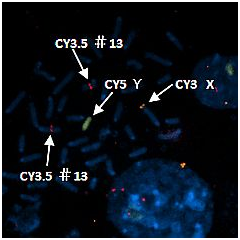 |
| Mouse FISH |
| CY3 | X |
| CY3.5 | #13 |
| CY5 | Y |
|
|
| |
 |